
 Samuel·4d ago

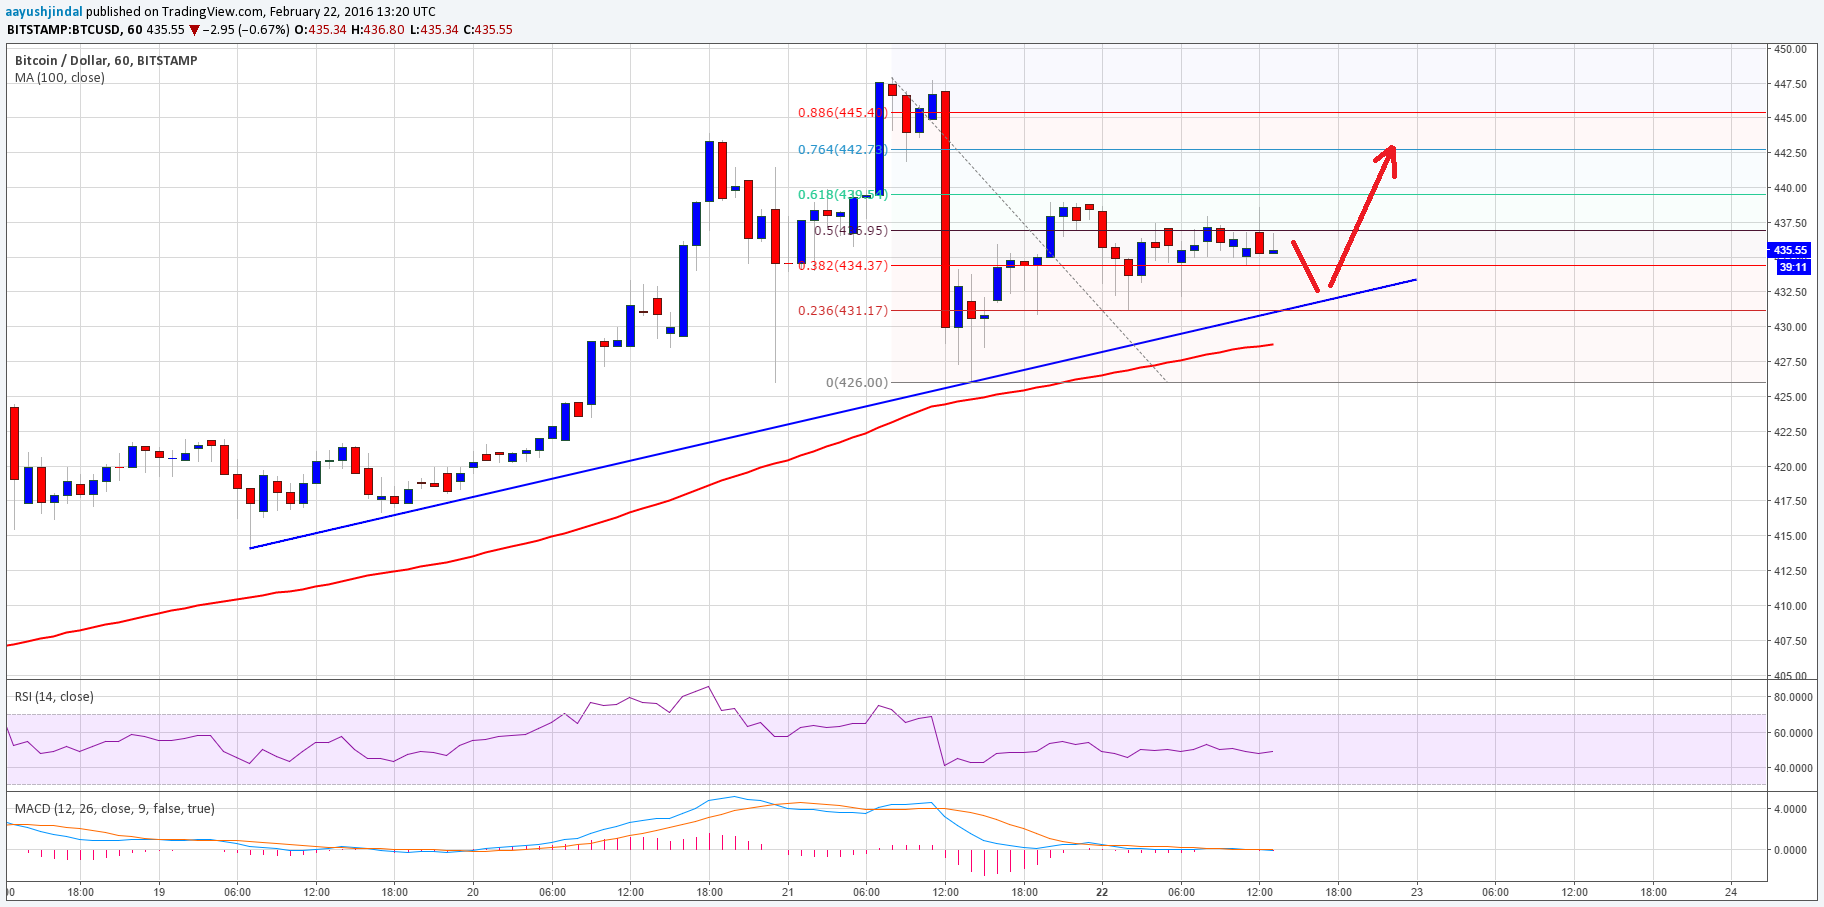
Bitcoin price continued to trade higher and almost touched $450. More gains are likely if buyers manage to retain bids moving ahead.
Bitcoin price managed continued to move higher, as the buyer’s strength prevailed sellers and outpaced them. There was a nice upside move, taking the price closer to the $450. We were expecting the price to get closer the stated level, and it looks like out target I achieved. The price is currently correcting lower, and it looks like there is a chance of it getting bids in the near term.
There is a major support trend line formed on the hourly chart (data feed from Bitstamp), which prevented a downside break today, and acted as buy zone for buyers. On the upside, the next resistance area may be around the 50% Fib retracement level of the last drop from the $447 high to $426 low. There is a chance that the price may continue to move higher in the near term.
The most important resistance is near the 76.4% Fib retracement level of the last drop from the $447 high to $426 low. The price is well above the 100 simple moving average (hourly, data feed from Bitstamp), which is a positive sign for the bulls.
Looking at the technical indicators:
Hourly MACD – The hourly MACD is almost flat, and may head towards the bullish slope.
RSI (Relative Strength Index) – The hourly RSI is just around the 50 level, calling for swing moves in the short term.
Intraday Support Level – $435
Intraday Resistance Level – $445
Charts from Bitstamp; hosted by Trading View
Related News
Explore more